| Search for content and authors |
Processing and analysis of synchrotron diffraction images of protein crystals |
| Miroslaw Gilski |
|
Department of Crystallography, Faculty of Chemistry, A. Mickiewicz University, Grunwaldzka 6, Poznań 60-780, Poland |
| Abstract |
| X-ray crystallography is a dominant technique used in determination of the three-dimensional structures of macromolecules. It is the most successful when applied on the third-generation synchrotron sources that allow rapid collection of X-ray data from macromolecular single crystals.
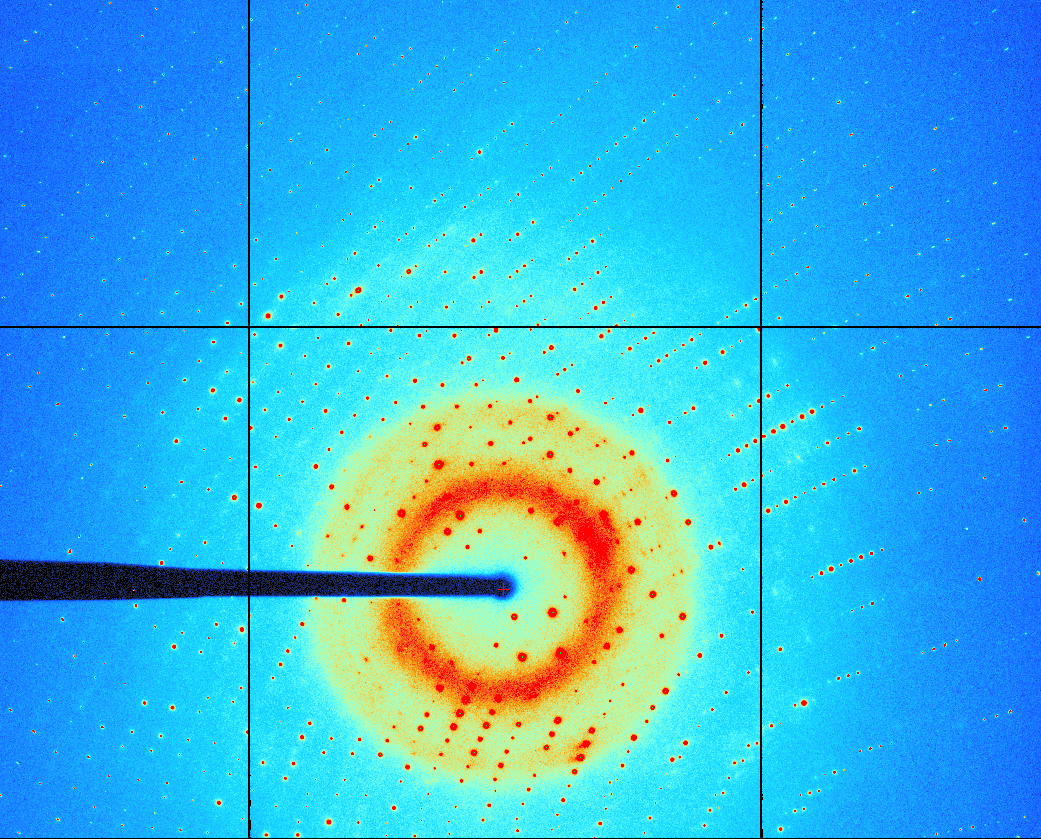
There are many reasons for this situation, including but not limited to, poor or unsatisfactory data quality, problems with automatic/semi-automatic processing and indexing of raw diffraction images or difficulty with structure solving, model building and refinement. Besides the crystal preparation the first and crucial step in the process of protein structure determination is a proper processing of the collected diffraction images, as they provide the observations which are used throughout the process of structure solution and refinement. The analysis and reduction of single-crystal diffraction data (data processing) consists of several steps like indexing of the diffraction pattern, refinement of the crystal and detector parameters, integration, scaling and statistical analysis of the measurements. Each of this steps can introduce some errors, dependent on data quality and also on algorithm used during the particular task. After evaluation and refinement of sample's unit cell and crystal orientation, the intensities for the Bragg spots can be determined. Algorithmically it is a very complex task but the most important during whole diffraction data processing. The ultimate result of the processing is a list of reflections which appear on images with their Miller indices (hkl), estimated intensities, and standard deviations. To analyze single-crystal diffraction data, several computer programs have been developed. To the group of the most popular and used programs belongs: HKL2000 [7], MOSFLM [8], D*TREK [9] and XDS package [10]. First three of them have dedicated Graphical User Interface (GUI) while XDS most often is used as a command line application with very good default parameters in template input file. MOSFLM has the most expanded GUI but all interfaces are to similar extend intuitive and provide reasonable starting values for the parameters essential in the data processing. To find out the advantages and disadvantages of data processing programs, ten very different data sets, including diffraction data from DNA/RNA [Fig. 1] and protein crystals were tested.
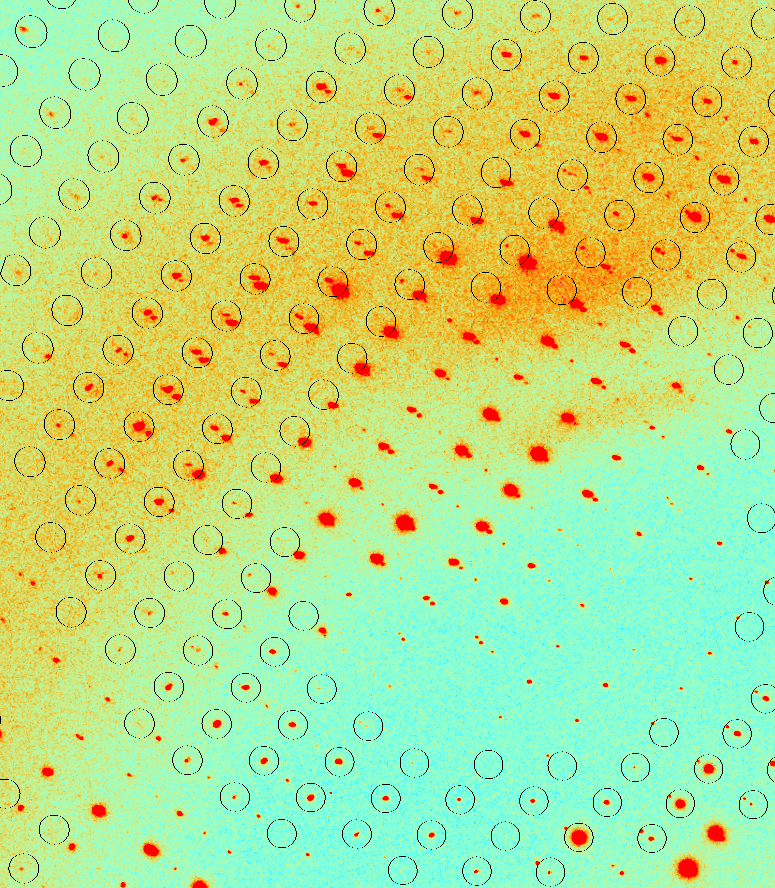
Figure 1. A macromolecular diffraction pattern for a strongly diffracting crystal of Z-DNA collected at Advanced Photon Source (APS), Argonne – beamline 24-ID-C, detector ADSC Q315. The maximum resolution at the edge of the detector is 0.54Å. Three of the data sets used during this study derive from macromolecular crystals which structures has been previously solved and refined. Originally two of them with extremely high resolution – 0.55Å and 0.75Å respectively, were processed by HKL2000. Reprocessing using XDS package gave, in both cases, higher resolution (0.54Å and 0.74Å), similar statistics and significantly larger number of reflections. The MOSFLM and D*TREK gave slightly worse results, rather similar to HKL2000. Visual inspection of the diffraction images of the third data set indicated an evident twinning of the crystal used during data collection [Fig. 2]. All software packages are able to process diffraction images originated from twinned crystals, but after several trials of reprocessing, it turned out that manual separation of not indexed and indexed spots in XDS seems to be fast, easy and the most efficient way to treat not complex twinning. Using this method, after processing the diffraction data of the next crystal, two sets of reflections (from two different lattices existing in the crystal) were obtained with completeness above 96% and good statistics. It means that in one data set are included two different structures of two forms of protein. Processing the remaining data sets reveals that XDS package with manually edited input file result in very good integrated intensities with the highest resolution and good statistical parameters. The XDS and MOSFLM are much more sensitive than other to the precise values of the direct-beam position while HKL2000 and XDS have somewhat more powerful autoindexing procedure and with default input parameters, they seem to give better merging statistics. The strength of XDS is in its ability to process data using all resources of the computer. Parallel XDS version (xds_par) uses OpenMP for execution by a team of up to 32 threads and relies on a shared memory multiprocessor platform. All packages can be run from a script, which makes them more suited for automation.
Figure 2. Fragment of the diffraction image with predicted reflections positions superimposed (circles). Not all reflections are predicted, visible spot splitting, associated with the twinning. It has been found that all the major programs for processing and analysis of diffraction data give excellent and comparable results with good quality, mid-range resolution data sets, but their treatment of very high resolution or imperfect data differs in terms of indexing, spot integration, scaling and the treatment of errors. The easy cases can be processed with any program, but for the difficult ones the best resolution and statistics were achieved by using the XDS package. If diffraction data are of good quality and the problem is relatively straightforward the automation approach to data processing may be appropriate. On the other hand, if one is trying to squeeze out as much information from the experimental data as possible, then only expert manual processing can be successful, regardless of the data quality. References [1] M. Gilski, Acta Physica Polonica A, Vol. 114(2), 331-338, (2008) [2] M. Jaskolski, M. Gilski, Academia 2(10), 8-11, (2007) [3] M. Gilski, Synchrotron Rad. in Nat. ScienceVol. 6, No. 1-2 (2007) [4] M. Grabowski, M. Chruszcz, M.D. Zimmerman, O. Kirillova, W. Minor, Infect. Disord. Drug Targets, 9(5), 459–474, (2009) [5] Z. Dauter, M. Jaskolski, A. Wlodawer, J. Synchrotron Rad., 17, 433–444, (2010) [6] M. Cymborowski et al. J. Struct. Funct. Genomics, 11(3), 211-221, (2010) [7] Z. Otwinowski, & W. Minor, Methods Enzymol. 276, 307-326, (1997) [8] A. G. W. Leslie, Jnt CCP4/ESF-EACBM Newsl. Protein Crystallogr. 26, (1992) [9] J. W. Pflugrath, Acta Cryst. D55, 1718-1725, (1999) [10] W. Kabsch, Acta Cryst.D66, 125-132 (2010) |
| Legal notice |
|
| Related papers |
Presentation: Invited oral at IX Krajowe Sympozjum Użytkowników Promieniowania Synchrotronowego, by Miroslaw GilskiSee On-line Journal of IX Krajowe Sympozjum Użytkowników Promieniowania Synchrotronowego Submitted: 2011-07-12 12:54 Revised: 2011-09-15 12:25 |